Excel Dashboard with - Pivot Tables and Automated Financial Reporting
Modern corporate financial management demands immediate, friction-free data orchestration. Relying on heavy, localized manual calculations or fragile script models introduces operational vulnerabilities. Instead, forward-thinking organizations are scaling their architectures around self-sustaining Pivot frameworks that convert complex transactional fields into intuitive executive panels with drag-and-drop ease.
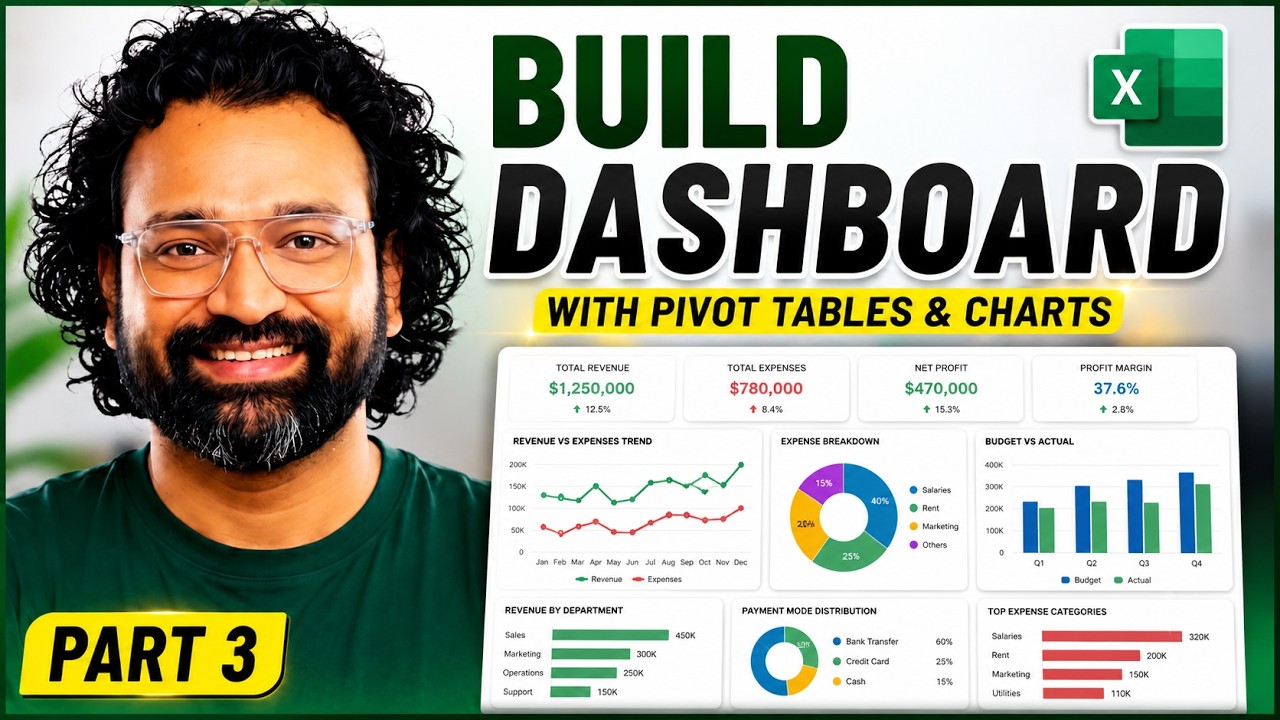
The key to implementing an enterprise-ready dashboard lies in structural segregation. By explicitly partitioning layout architecture across isolated Transactions, Calculations, and Pivot Table layers, changes can execute smoothly across the entire business suite without breaking operational dependencies.
Strategic Implementation Guide
Phase 1: Dynamic Data Layer Engineering
Begin by isolating your raw transaction records. Instead of referencing variable column fields, convert source inputs into defined, native data tables. Map Months straight to structural Row fields, drop business transaction Types cleanly across the Column layout, and pipe underlying Amounts straight into the structural Values box to effortlessly summarize thousands of rows of tracking history.
Phase 2: Executive Visualization Framework
With a clean data core established, deployment transitions into building target visualization systems:
- Trend Analysis Panels: Deploy custom Line with Marker charts to visualize net cash cycles over rolling timelines.
- Structural Breakdown Matrices: Filter outgoing operational cost fields explicitly using Donut chart systems to display clean percentage breakdowns.
- Overhead Controls: Bridge targets together using Clustered and Stacked Bar layouts to keep variance comparisons like Budget vs. Actual explicitly visible.
Comments