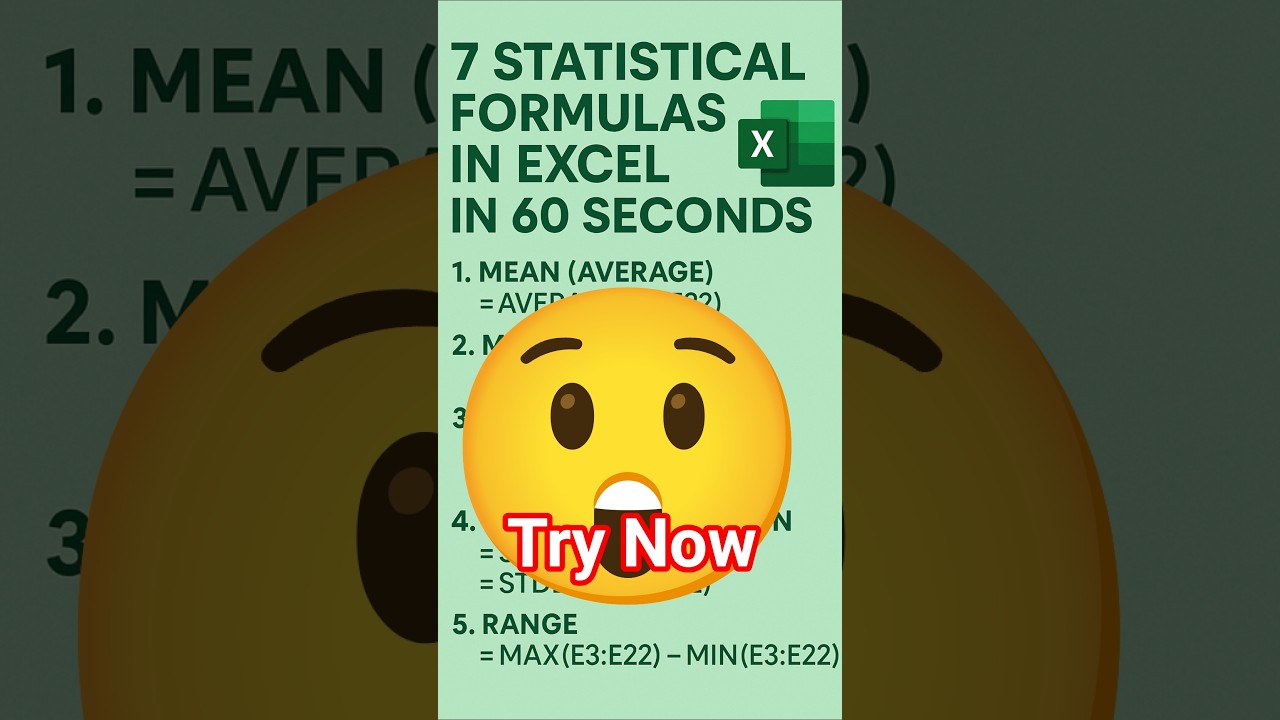
7 Statistical Formulas in Excel — Learn in 60 Seconds
If data ever feels overwhelming, you're not alone. That’s exactly why this quick 60-second guide exists — to help you instantly understand the most essential statistical formulas in Excel. These are the tools that make numbers feel clearer, cleaner, and surprisingly friendly.
Whether you're a student, a beginner, or just trying to level up your day-to-day work, these formulas will save you time and make your analysis way smoother.
- AVERAGE — Find the mean
- MEDIAN — The true center value
- VAR.P / VAR.S — Measure data spread
- STDEV.P / STDEV.S — Standard deviation
- MAX & MIN — Quick boundaries
- RANGE — Max minus Min
- COUNT / COUNTA — Fast counting
Want to see these formulas in action? Click the thumbnail below to watch the 1-minute YouTube Short instantly.
If you enjoyed this quick breakdown, you’ll absolutely love the ultra-short 15-second tutorials waiting for you on our channel. They’re bite-sized, practical, and easy to apply instantly.
Comments