By Discover Talent • Data & Analytics
How to Analyze Union Budget Data in Excel Using YOY Growth, KPIs & Charts
India’s Union Budget provides critical insights into government priorities across infrastructure, healthcare, education, defense, and agriculture. In this tutorial, we break down how to analyze year-on-year budget allocations using Microsoft Excel — transforming raw numbers into powerful visuals and decision-ready insights.
The process begins by calculating year-on-year growth using a simple Excel formula that compares the current year’s allocation with the previous year’s budget. Once calculated, the values are converted into percentage format, allowing instant interpretation of spending increases or decreases.
To make the insights clearer, conditional formatting can be applied to categorize changes as high, medium, or low. This instantly highlights which sectors are gaining momentum and which are seeing reduced emphasis.
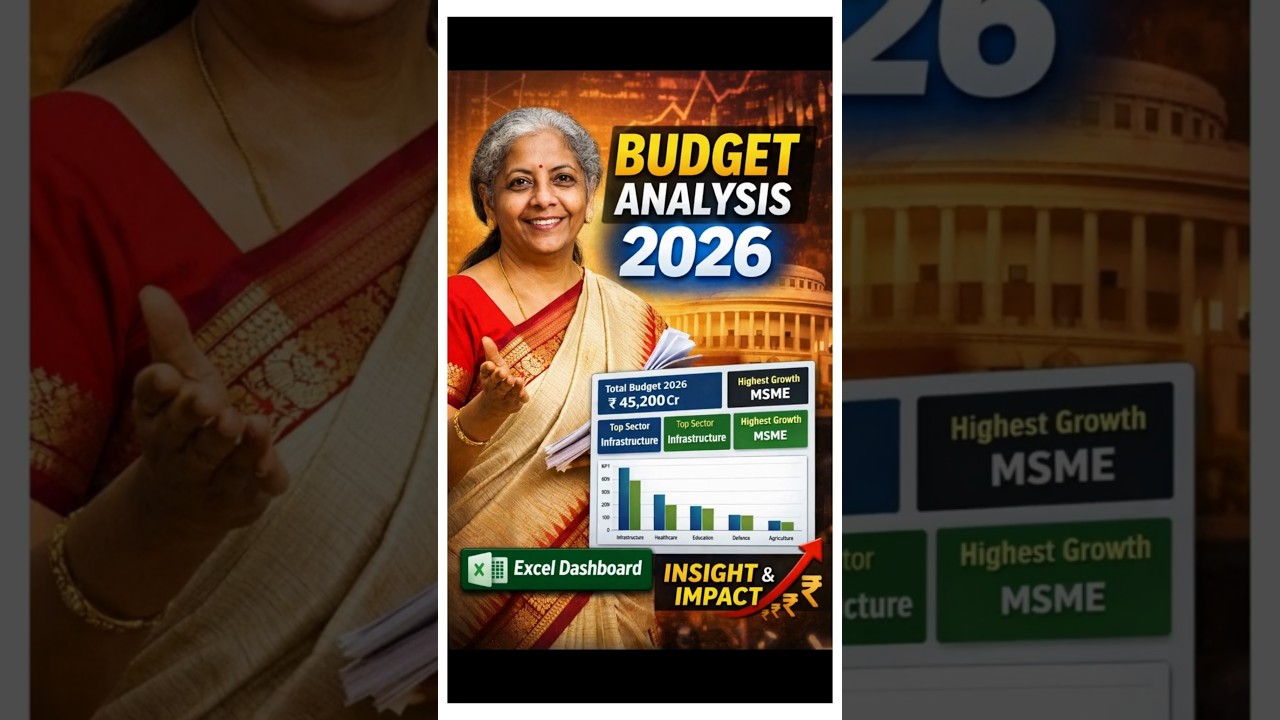
Visualization is where the analysis truly comes alive. By using Excel’s combo chart feature, stacked columns can represent total allocations while a line chart overlays year-on-year percentage changes. This dual-axis approach provides both scale and trend clarity in a single view.
Finally, the data is summarized into KPI-style figures, helping analysts and decision-makers quickly identify maximum spending shifts between years. This method is ideal for finance professionals, students, civil service aspirants, and anyone working with public finance or business budgeting.
Watch the Full Walkthrough
Related Reads
- Excel KPI Dashboards for Beginners
- How to Build Combo Charts in Excel
- Government Budget Data Visualization Techniques
Connect with Discover Talent
Official Website | YouTube | LinkedIn | Instagram | Discord
If this helped you understand budget analysis better, share it with your network and explore more Excel tutorials from Discover Talent.
Comments